The rule fits in one sentence: count the heroes already selected; use the counting estimator below the threshold and the fitted model at or above it.
After all the architecture work, this is approximately the amount of logic I'd use to decide whether to take an umbrella.
The two halves need their proper names. The first composes bracket-aware, shrunk estimates of hero strength and pair effects. The second is the small, jointly trained structured pairwise model introduced in Part 9, not the Transformer. Both can score an unfamiliar lineup by combining learned parts. Neither requires that exact ten-hero combination to have appeared before.
Choosing the Boundary
Part 9 suggested a crossover around five or six already-selected heroes. But that observation came from a test partition I had already inspected.
For the hybrid experiment I swept thresholds from zero through ten on validation. Those endpoints mean using the model everywhere or the table everywhere. The rule shouldn't be forced to use both if one estimator wins throughout.
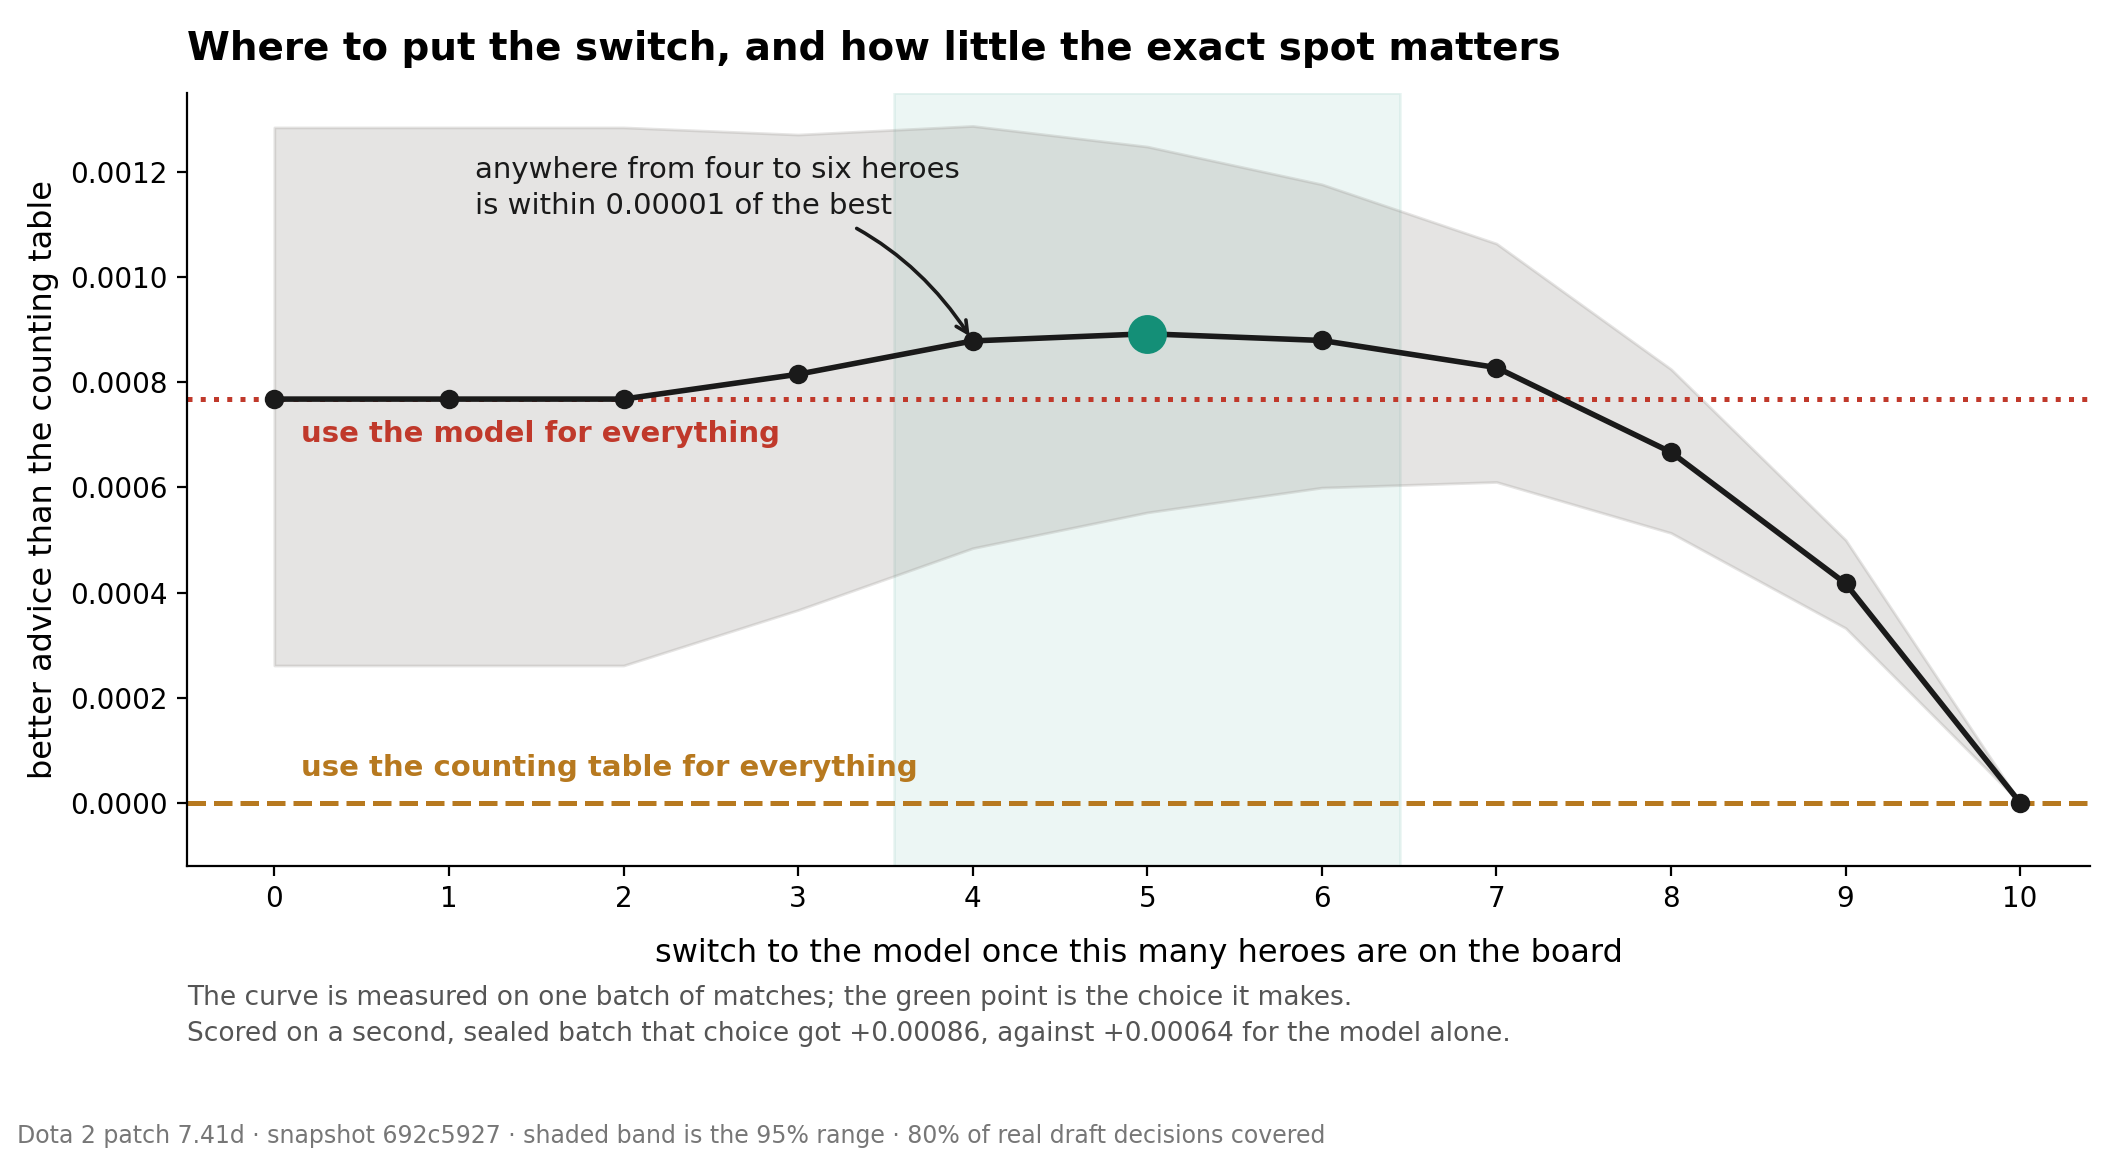
Validation selected five. Thresholds four, five, and six were within 0.00002 of one another on that comparison. A broad plateau was more reassuring than a setting that worked only at one exact integer, though it wasn't a promise that the same boundary would survive a new patch.
Using validation avoided choosing the precise threshold from the reported test score. It did not erase the earlier use of that test data to motivate the hybrid. This remained an exploratory research sequence.
What the Combined Estimator Scored
The historical E27 experiment used a 600,000-match sample of the later test partition. The metric was within-context concordance: how often the scores ordered winning rows above losing rows within similar draft contexts. It covered states representing 80% of the trace-derived request mass. These are margins over the counting baseline, not raw win rates:
| Estimator | Concordance margin | Reported interval |
|---|---|---|
| Counting estimator everywhere | 0 | Reference |
| Structured model everywhere | +0.00064 | +0.00009 to +0.00121 |
| Table early, model late | +0.00086 | +0.00049 to +0.00124 |
The direct evaluation of the assembled research hybrid agreed with the result computed from its two arms. That was an implementation check, not a second independent experiment.
Below the boundary the hybrid is identical to its counting baseline, so their difference is zero there. That helps the comparative result. It does not make the table's estimates certain or eliminate uncertainty about future games.
The intervals describe the historical evaluation procedure, conditional on its sample and grouping choices. They do not cover all the uncertainty from model training, research decisions, or deployment. In particular, the aggregate interval combines state-level bounds rather than coming from a fresh, independent evaluation of the finished product.
I also repeated the recipe at two additional training seeds, allowing each to choose its own threshold:
| Training run | Threshold | Model-only margin | Hybrid margin |
|---|---|---|---|
| Original | 5 | +0.00064 | +0.00086 |
| Second seed | 4 | +0.00055 | +0.00069 |
| Third seed | 6 | +0.00067 | +0.00089 |
All three favoured a hybrid within the same plateau. That checks initialization sensitivity within this recipe. It is not replication on three independent populations; the data was shared.
What +0.00086 Means
On the metric's weighted population of comparisons, +0.00086 corresponds to about 86 additional correctly ordered win/loss pairs per 100,000 comparisons. Tied predictions receive half credit.
It does not mean 86 extra wins, or a player winning one more game in a thousand by following the tool. No trial of that policy was performed. Nor do I know what fraction of all achievable drafting value this margin represents.
It is a small improvement over a useful baseline on a particular research instrument. That is enough to justify testing the combination further, without calling it a solved draft advisor.
The Artifact Is Small; the Contract Still Matters
The prototype's table and model payloads totalled about 3.33 MB. Against the reported 3.38 GB snapshot size, that's roughly 0.1%, not a thousandth of a percent. Serving the scores requires arrays and arithmetic, not a database query or a running Transformer. The source data still matters for retraining and audit; it wasn't disposable scaffolding.
One of my example scripts made the familiar hero-ID mistake again. It enumerated embedding indices instead of real heroes and reported 149 candidates after six picks. The artifact represents 127 heroes, so six distinct picks and no bans leave 121. The separate serving interface restricts candidates to that roster. I've withdrawn the old recommendation chart rather than preserve ranks computed in an invalid candidate pool.
The later release also needs to be distinguished from this prototype. The inspected serving artifact uses one trained pairwise model for scores and two additional seed checkpoints to estimate a limited spread. It does not average all three into an ensemble prediction. Its counting tables were eventually refitted on train plus validation.
Part 14 covers that release and the limits of its integration test. The result here belongs to the historical hybrid experiment, not automatically to every subsequent build that uses the word "hybrid."