Last time ended with a bet I made in public.
I'd just found out that a lookup table -- no model, no training, just counting how often each pair of heroes won -- was giving better draft advice than my neural network. My argument for why I should keep going was that the table only looks good because the early draft is easy. Ask it about one hero against one hero and it has forty-three thousand real matches to average. Ask it about a half-finished draft and it has a handful. A model should degrade more gracefully than that.
So I wrote down the test:
Race them both down the draft, one hero each, then two, then three, then four, and find the crossover. If the model overtakes the lookup partway down, that crossing point is the product. If it never does, I don't have a product yet and I should say so rather than tune another hyperparameter.
I ran it. This post is the answer, and I'm pleased to report it's the good one -- though not in the shape I expected, and the measuring equipment took three goes to get right.
What "better advice" actually means
Skip this if you like, but it's the part that took longest to get right, and everything after depends on it.
The obvious way to grade a draft model is to ask how often it predicts the winner. That turns out to be nearly useless here.
Draft is a small slice of what decides a Dota match. The rest is ten people playing it for forty minutes.
So a model can get meaningfully better at predicting winners while giving identical advice. Most of that improvement is just learning that some heroes are stronger than others -- true, useful, and no help whatsoever when you're choosing between five heroes you'd actually consider.
What I want to know is different: among the heroes you might realistically pick right now, does the model put the better ones higher?
Here's how you measure that without a simulator. Freeze a draft situation -- say both teams have three heroes down. Go find every real match in the held-out data that passed through a situation like that. Each of those matches picked some hero next, and then won or lost. Now ask: were the matches where my model liked the pick the ones that won more often?
That's it. No causal claim, no "if you'd picked differently you'd have won." Just: when the model approved of what actually happened, did it go better?
Two details make it honest.
The first is that I subtract out plain hero strength before scoring anything. Say Ancient Apparition is having a good patch and wins a bit more than average no matter what. A model that ranks him highly in every single situation would look clever by accident. So the question isn't "did it like Ancient Apparition" -- it's "did it like Ancient Apparition more than usual when the enemy had just picked Necrophos, who he happens to shut down." Only the second thing earns credit.
The second is that everything below comes from a sealed batch of 2,774,578 matches the model has never seen, played later in time than anything it trained on. The chart further down reads a 600,000-match sample of that batch. If the way people draft drifted in between, that counts against me, which is exactly the point of testing on later matches rather than a random slice of the same ones.
The first test was rigged, and I was the one who rigged it
My original version of this test only worked in one situation: one hero picked on each side.
There's a good reason for that. To grade a specific hero choice you need real matches that made that exact choice, and once a few heroes are on the board, no two drafts are alike any more. The data runs out. So I built the test where the data was thickest and told myself that was rigour.
It's the state where a counting table has forty-three thousand matches per question. I built a test that could only ask my model to fight on the one patch of ground where its opponent is strongest, and then I was surprised when it lost.
It covered 6% of the decisions a real draft advisor gets asked about. The other 94% were invisible.
I fixed it with something I'd built for another purpose entirely. Instead of demanding two drafts share the exact same heroes, sort heroes into rough families by how they behave against everyone else, and match on the shape of the draft instead.
Concretely: if the enemy has a hero who out-heals your damage, it doesn't matter enormously whether that's Necrophos or Huskar or Dazzle -- the question facing you is the same question, and the answer is some flavour of "bring the thing that stops healing." Treat those three drafts as one and suddenly you have thousands of matches to look at instead of nine.
You lose precision doing that. That's the price. What you buy is the ability to ask the question at all past the opening picks, and it took coverage from 6% of real decisions to 80%.
I have to flag something here, because it would be easy not to.
I redesigned this test after the first version failed, knowing exactly which situation my model had lost in. That is the move that lets someone quietly grade themselves into a pass.
Two things keep me honest. I left the original situation in as a hard requirement that can still sink the whole test -- and it does still fail there. And I'd written down the case for the new instrument on the day the old test failed, before running it on the held-out matches even once.
It's a real caveat. I'd rather you have it than not.
The race
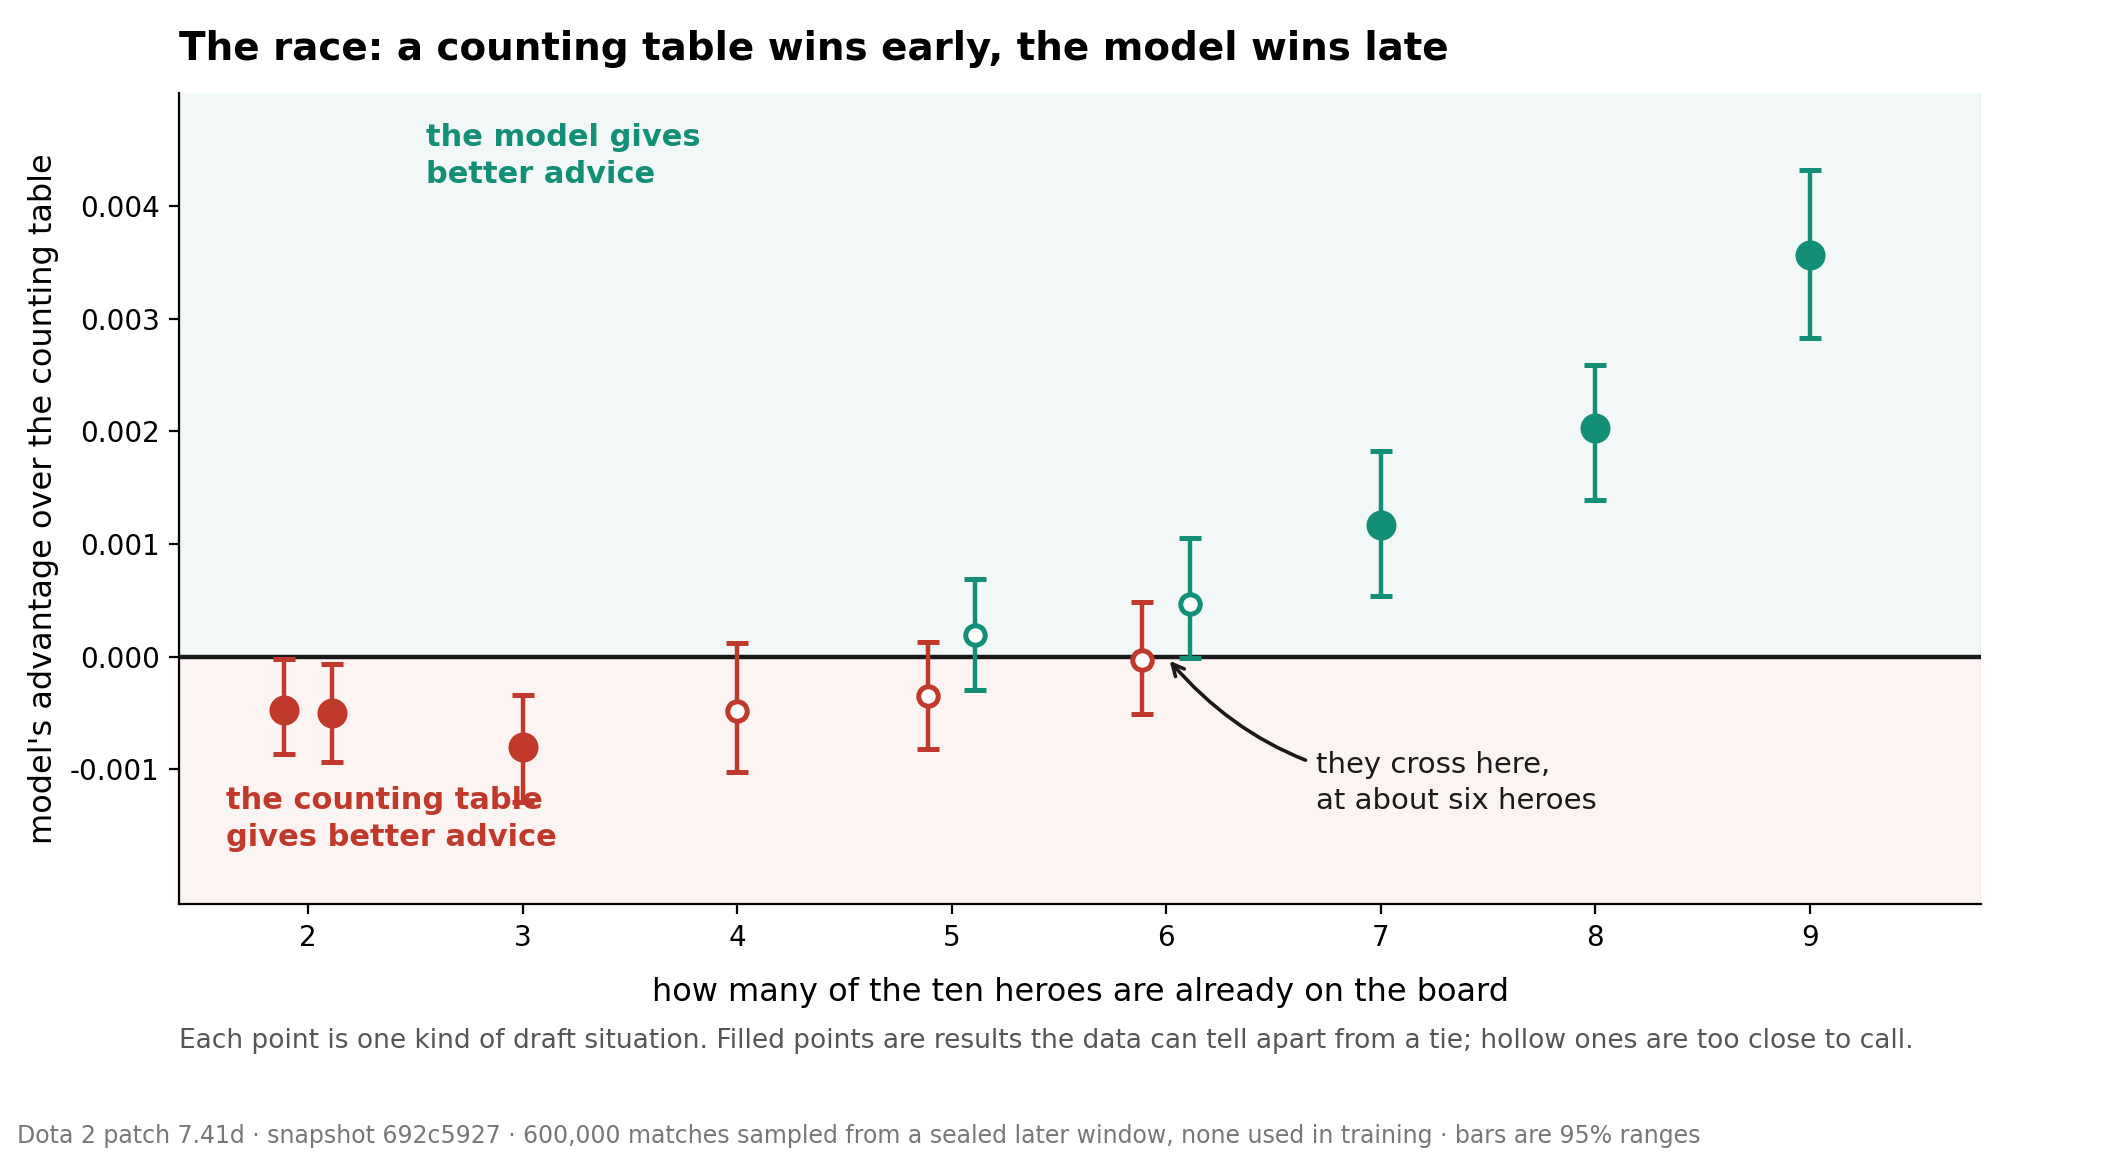
There it is.
Early in the draft the counting table gives better advice, and it isn't close enough to argue about.
Late in the draft my model does -- and by nine heroes on the board its lead is roughly four and a half times the size of the table's early lead. They cross at about six.
What I did not expect was which number predicts the winner.
It isn't how many heroes my side has. It's the total on the board, both teams combined.
You can see it in the pairs. At five heroes there are two points, and at six there are two more. Each pair is one situation where I hold the extra hero and one where my opponent does, which are quite different problems if you're the one picking. Neither pair comes apart.
And if you let the two counts compete directly -- fit the model's advantage against my hero count and the enemy's hero count as separate quantities and see which one the data leans on -- they come out weighted almost equally. A hero on their side counts about the same as a hero on mine.
What matters is simply how much of the draft has already happened.
Which, in hindsight, is exactly what I argued would happen -- I just didn't know where the line would fall.
I want to be fair to the table here: its problem was never that counting is stupid. Counting is great. Its problem is that every hero you add to the board makes the question narrower, and narrower questions have fewer matches behind them. One hero against one hero: 43,746 real matches to average over. A specific three-hero combination: about 759. Keep going and you're asking about an arrangement of heroes that has occurred a few dozen times in twenty-two million games, or never.
At that point the table isn't wrong so much as guessing with a straight face. Six heroes on the board is where its evidence gets thin enough that a model which has generalised -- which has learned something about heroes it can apply to a combination it has never seen -- starts being the better bet.
Put in terms of actual draft decisions:
| how much of the draft is done | share of real decisions | who gives better advice |
|---|---|---|
| two to five heroes on the board | 40% | the counting table |
| six heroes on the board | 10% | too close to call |
| seven to nine heroes | 30% | the model |
That accounts for 80 of every 100 real decisions. Of the twenty missing, half are the very first pick, where nothing is on the board at all -- and there the question is just "which heroes are strongest," which a counting table answers as well as anything could. The other half have exactly one hero showing, which is the counter-picking question I spent all of Part 7 measuring. So the hole is smaller than the number makes it sound.
I've been carrying around an assumption for months that one of these two things was going to turn out to be the answer. Neither is. I was wrong. The honest answer is both of them, with a rule about when to use which -- and the rule is embarrassingly simple: count the heroes on the board.
That's not the result I wanted when I started. It's a considerably more useful one than "my model is good," because it comes with instructions.
And it does formally settle the bet from Part 8. The overtake happens. The crossing point is the product.
I should say plainly that the full test I wrote for myself did not pass. Six criteria, five passed.
The one it failed asks that the model never be clearly worse than the table anywhere it might be asked. It is clearly worse in three situations, and all three sit at the shallow end: two or three heroes on the board, a fifth of real decisions. Which is less a new finding than the same finding stated as a failure. Early in the draft the table is better, and I had written a test that asked for a model which is never behind.
"Have you tried a bigger model"
Yes. Let's do this one properly, because it's the question I get most and it's the one I most wanted to be wrong about.
My honest hope, for months, was that somewhere in here was an architecture mistake -- that I'd find it, scale the thing up, and watch a large model pull away from a hand-built one. I like that story. It's the story the field mostly tells.
So I trained three models that differ only in size: same data, same schedule, same number of passes, same everything. The smallest has about a million adjustable numbers inside it, the largest just under five million -- that count is the usual rough proxy for how much a network is capable of memorising. And I made a point of writing down beforehand which result I'd look at, because I know what I'm like.
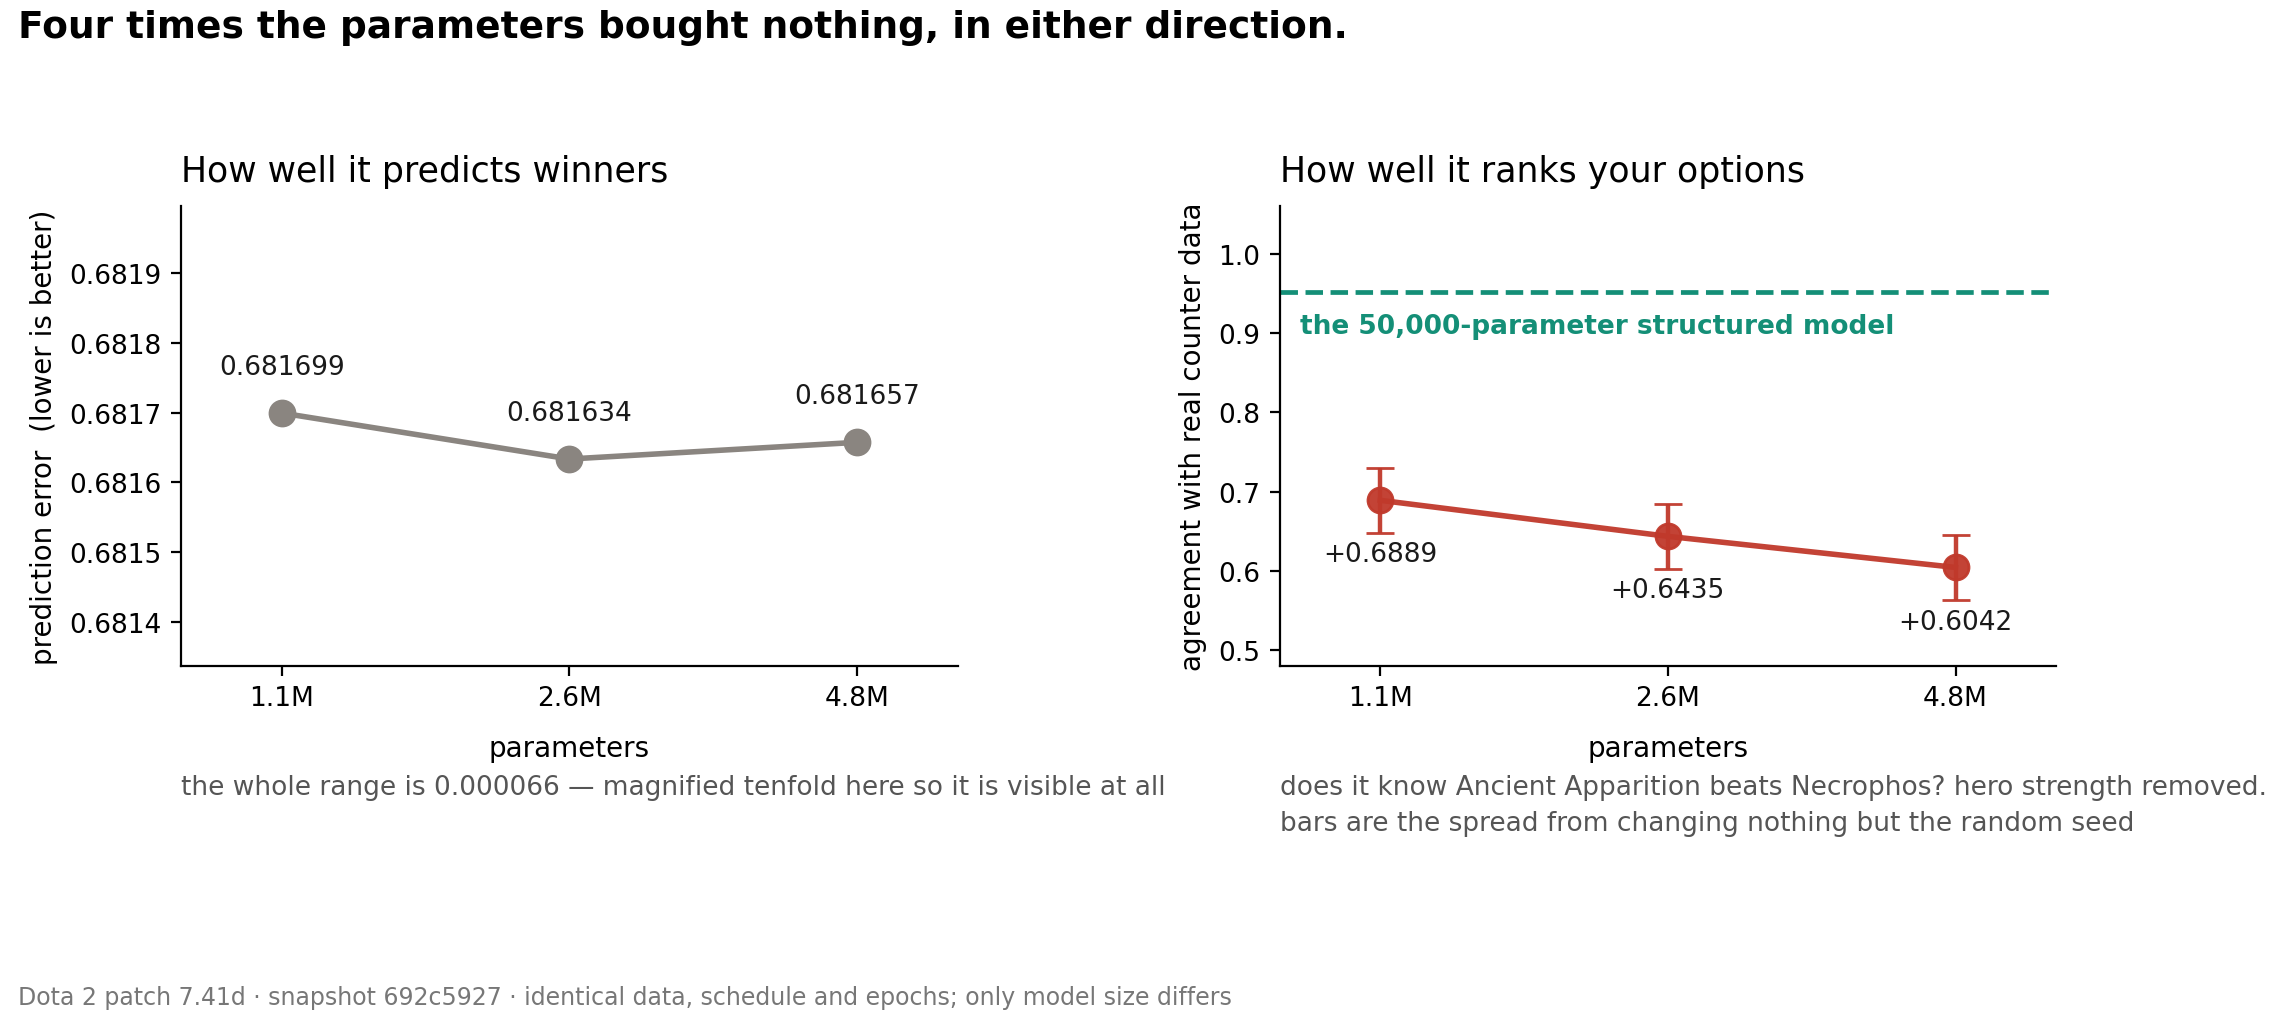
Four and a half times the parameters. On prediction quality: nothing -- the entire spread is smaller than the difference between running the same setup twice, and I had to magnify the axis tenfold to show it isn't a perfectly flat line. On the thing I actually care about, reading how heroes play off each other: also nothing I can defend.
Those error bars need explaining, because they are the whole reason this section is shorter than it was in my first draft.
After I wrote it, I finally ran the experiment I should have run months earlier: take one setup and train it three times, changing nothing but the random number seed. On the winner-prediction panel the three runs agree to five decimal places. On the ranking panel they spread by 0.076 -- which is larger than the gap between my smallest and largest model.
So the downward slope you can see in the right-hand panel is real in the sense that I measured it, and meaningless in the sense that I would expect to see a slope about that size from doing nothing at all. What I can say is that four and a half times the parameters did not help. What I wanted to say -- that it made things steadily worse, which is a much better story -- is not supported.
That dashed green line is a fifty-thousand-parameter model I wrote by hand, which reads hero interactions better than anything on the chart.
One detail that makes this more damning rather than less. All three share a setting that controls how big a step the model takes each time it learns something, and I had to pick one value that worked for all three sizes. That value is not the small model's best one -- it is handicapped against its own tuned setting, while the two larger ones sit near theirs. I tilted the comparison in favour of the big models without meaning to, and they still lost, in a straight line, every step of the way.
I don't think this means scale never helps. Four and a half times is not a hundred times, and I can't afford a hundred times. What it means is narrower: over the range I can afford, the money bought nothing measurable, and the one number that would have made "bigger is worse" a real finding turned out to be inside the noise of my own equipment.
What I think it means is narrower and more interesting.
The small model isn't smarter. It's just been told the rules of the game before it starts. It is physically built so that the only things it can express are "this hero is good," "these two heroes are good together," and "this hero beats that one." It cannot learn anything else, because there's nowhere to put it.
The neural network gets no such head start. It has to work out that heroes even interact in the first place, from nothing but ten hero names and a win or a loss, at the same time as it's learning that Anti-Mage is strong and that Radiant wins slightly more often. And here's the thing: hero strength is easy. It's a single number per hero and there's a mountain of evidence for it. Hero interaction is hard -- it's a number for every pair, and each one has a fraction of the evidence.
Give a model limited capacity and both jobs, and it does the easy one first. So it gets very good at the thing that barely affects your draft, and stays mediocre at the thing that is the entire point. Making the model bigger doesn't change that ordering. It just buys more room to keep being excellent at the easy job.
That, I think, is the actual lesson of six weeks: the constraint was never how much the model could learn. It was what I'd told it to look for.
Where this leaves things
So I've settled the bet, and the answer is a boundary rather than a winner: count the heroes on the board; early, trust the counts; late, trust the model. Both of them together are about three megabytes, which is a pleasant surprise for something I'd been assuming would need a database behind it.
There's a caveat I want on the record. I graded on matches that are genuinely held out -- later in time, never trained on. But I've now used that same batch twice, and the second time I designed the test knowing how the first had gone. The shape of the result survives that concern better than a single summary number would. But before I'd claim a specific crossing point as the number rather than about six, it deserves a fresh batch of matches nobody has looked at.
Next time is the one I've been putting off: an accounting of everything that went wrong getting here.
Not the experiments that failed. Those are fine, that's the job. I mean the eight separate occasions where my own measuring equipment was broken, told me something confident and false, and I believed it for a while.
One of them cost two runs on a GPU. One had been sitting in my documentation for weeks, a number I'd quoted in three places, which turned out on inspection to be the size of my training set wearing a false moustache. One of them I had explained, correctly and at length, in Part 1 of this series -- and then shipped the opposite of it in the code, where it quietly deleted an entire region of my search space for six months.
Two of them are in this post. One is in the test the whole race is built on, and one is the reason the error bars on that scale chart exist at all -- I found both after the draft you have just read was finished. Every number above is the corrected one. Both charts are second attempts.
That's Part 10, and it is the post I'd most want a stranger to read.