Part 4 ended with a promise: the model knows what a carry is, the model knows Chen is weird, and next time we find out whether any of that helps me win a game of Dota.
This is not that post, because something better happened on the way.
I went to top up the training data first, like a responsible adult. Eighty-five minutes later I was sitting in front of 26.8 million Dota matches -- every public All Pick game played in the current patch window, all of them, not a sample -- and I have been doing very little else since.
Let me explain why that number knocked me over, and then let me show you the first genuinely strange thing inside it.
What Data Used to Cost
The old collector paged through OpenDota's /publicMatches endpoint. A hundred matches per request, against an unauthenticated allowance of three thousand requests a day. That's a ceiling of three hundred thousand matches a day if you spend your entire budget on nothing else, and in practice I was pulling a couple hundred a minute while also trying to do other things with the quota.
At that rate, the 26.8 million matches I now have would have taken eighty-nine days. Three months of my computer quietly doing one thing, to read one patch.
So I built the collector you build when data costs that much. Durable resume cursor. Process lock. Exponential backoff. Quota-header awareness, so it stopped short of the daily limit instead of getting itself banned. Provenance on every row: which request fetched it, when, from which cursor position. It was, I thought, rather good.
It was also stuck. An hour into a production run it had made 599 successful requests, zero errors, and had not moved its historical frontier at all.
The culprit was a number in a checkpoint that read 6.25 and would not change. The collector estimated how fast Dota burns through match IDs, so it could convert "jump back six hours" into "jump back N IDs" -- but I had guarded that estimate behind a rule that it only update from pages spanning at least sixty seconds. The pages it actually saw spanned 37 seconds. 36. 45. 55. 60.
One tied. None passed. I had built a thing that learns from experience and then set the bar for "experience" just above what experience could reach.
Here's what that frozen number was up against, now that I can finally measure it:
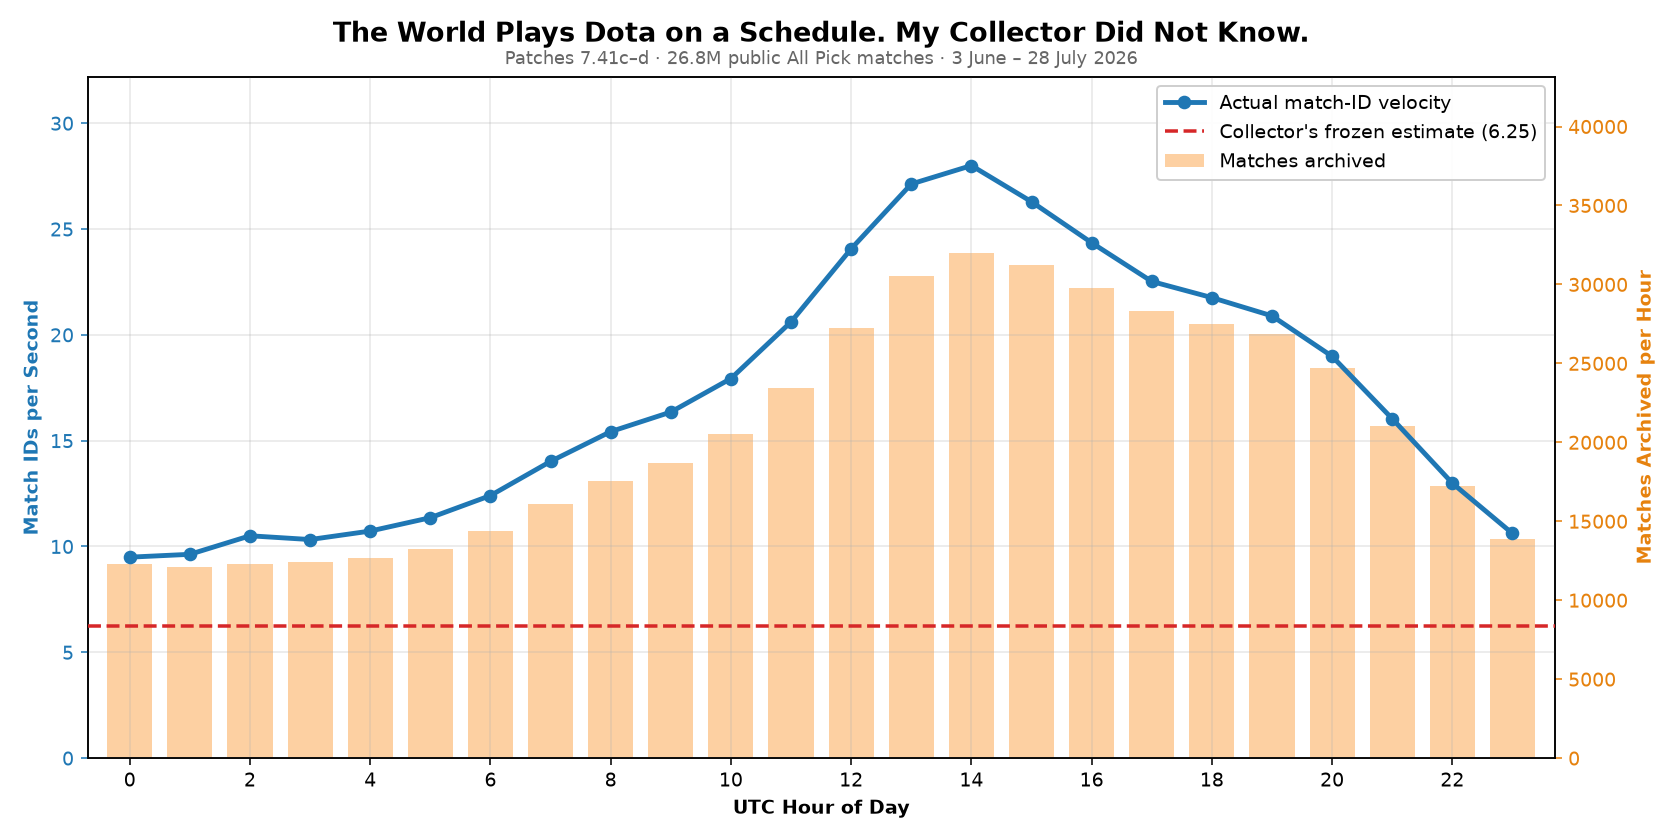
The world plays Dota on a schedule. The rate climbs from 9.5 IDs per second at midnight UTC to 28.0 in the early afternoon and slides back down -- very nearly threefold, every single day. Across individual hours the spread is wider still: the quietest hour in the whole window ran at 7.4, the busiest at 34.6.
The peak is late evening in China, dinnertime in India, mid-afternoon in Europe. The trough is eight in the evening on the US East Coast. Dota's global low point is American prime time, which I find quietly delightful.
My collector believed 6.25. Forever. Below the floor of a curve it never got to see.
The Word I Never Read
The fix was two characters. Change 60 to 30 and the estimate starts learning. I nearly shipped it and felt clever.
What stopped me was doing the arithmetic on what it would buy: a correctly-paced walk through three months of waiting.
So I went back and read the endpoint documentation properly, and found this, in a sentence I must have skimmed forty times:
/publicMatches returns randomly sampled public matches.
Randomly sampled. My beautifully instrumented, resumable, provenance-tracked pager had been carefully enumerating a random sample. Every page was a hundred matches drawn out of a hat, and my careful cursor arithmetic was lending them a false air of completeness.
So I went back to the endpoint list to see what else I'd skimmed past. And at the bottom, where important things live, there was one called /explorer.
/explorer takes SQL. Real read-only SQL, against OpenDota's own PostgreSQL, including the exact table /publicMatches had been sampling from on my behalf this entire time. I tried a bounded query, expecting a polite refusal or a cap somewhere around a few hundred rows.
It returned fifty thousand.
One request. Same rate limit. The same one-of-three-thousand-per-day that a hundred-row page had been costing me.
Five hundred times the data per call changes what kind of problem this is. At a hundred rows a request, reading a patch window is an infrastructure commitment that needs a daemon and a supervisor. At fifty thousand, it's an errand. I rewrote acquisition as a backward walk over match-ID windows -- half-open bounds so nothing is dropped or doubled at the seams, idempotent inserts, a checkpoint after every window -- and ran it.
996 requests. Eighty-five minutes. No failed windows, no truncated ones. 26,846,193 matches.
Eighty-nine days, or eighty-five minutes. Same provider, same rate limit, same afternoon. The only thing that changed was which door I knocked on.
Suddenly Rich
Here's the part I didn't anticipate: having the data turned out to be its own event.
For two years this project has been shaped by scarcity. Every question I wanted to ask, I first had to ask whether I could afford to ask it. Six hundred thousand matches meant thinking hard about which slice to spend them on. Now there's a three-gigabyte file on my desk containing every game everybody played for eight weeks, and the correct response to that is emphatically not to start training a model. The correct response is to go look at it.
So the first thing I asked was the question this project has been circling since Part 2, when I found -- to my genuine confusion at the time -- that a model trained on low-rank matches predicted outcomes better than one trained on high-rank matches.
The question: does a hero's win rate depend on who's holding it?
I have 127 heroes and seven rank brackets from Herald to Divine, every match of it inside patch 7.41d. Every single hero has at least three thousand games in every single bracket, which is enough that a win rate stops being a rumour and becomes a measurement. So: plot each hero's Herald win rate against its Divine win rate, and draw the line where those two would be equal.
One caveat before the picture, because it matters: everything below is a single patch. Valve moves these numbers deliberately and roughly monthly, so read the specific heroes as a photograph of 7.41d rather than a law of Dota.
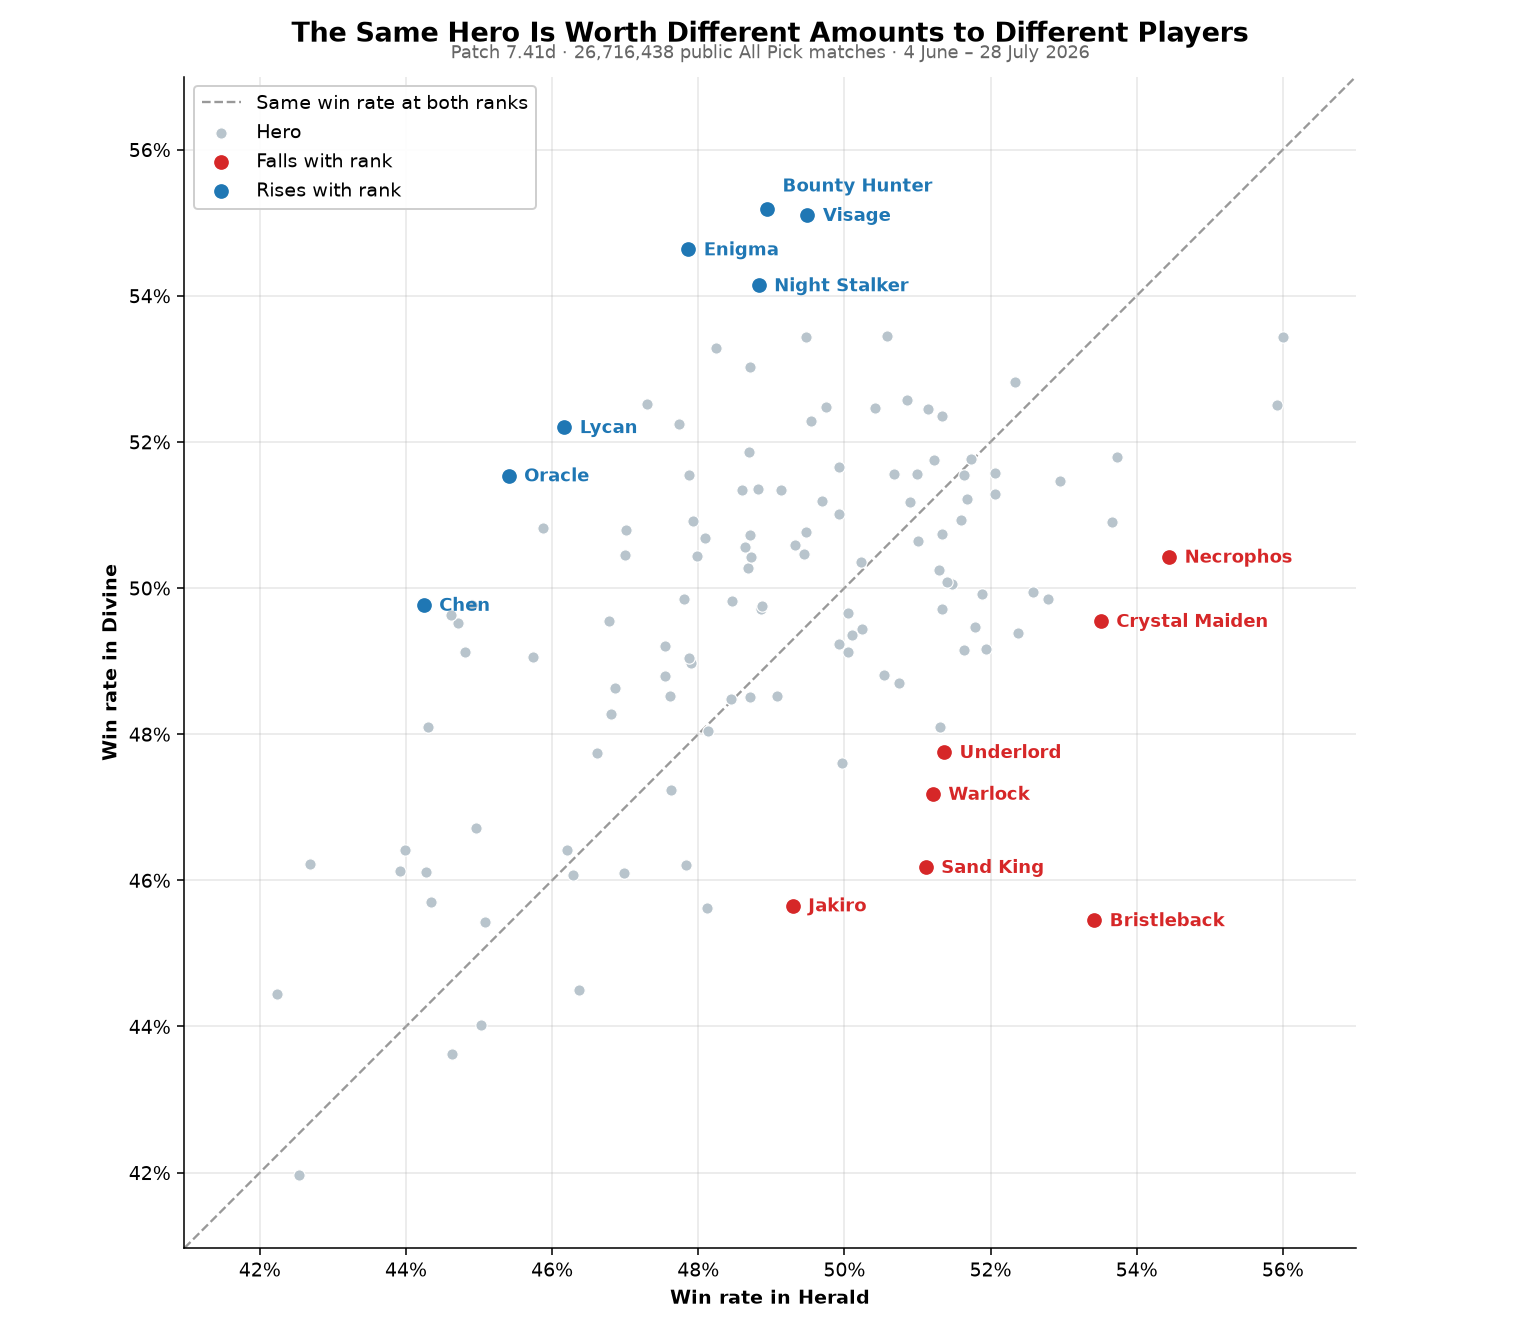
Almost nothing is on the line.
Bristleback wins 53.4% of his games in Herald and 45.5% in Divine. That's an eight-point collapse, and it isn't noise -- it declines strictly and monotonically at every one of the seven rungs: 53.4, 51.0, 48.9, 47.6, 46.7, 46.2, 45.5. He is one of the best heroes in the game at the bottom of the ladder and one of the worst at the top, and he is the same pile of numbers the entire way up.
Enigma does the exact opposite, just as smoothly: 47.9% in Herald, climbing to 54.6% in Divine.
And once you line up the biggest movers in each direction, they stop being a list and start being a sentence:
| Hero | Herald | Divine | Change |
|---|---|---|---|
| Bristleback | 53.4% | 45.5% | -7.9 |
| Sand King | 51.1% | 46.2% | -4.9 |
| Warlock | 51.2% | 47.2% | -4.0 |
| Necrophos | 54.4% | 50.4% | -4.0 |
| Crystal Maiden | 53.5% | 49.5% | -4.0 |
| Visage | 49.5% | 55.1% | +5.6 |
| Lycan | 46.2% | 52.2% | +6.0 |
| Oracle | 45.4% | 51.5% | +6.1 |
| Bounty Hunter | 48.9% | 55.2% | +6.3 |
| Enigma | 47.9% | 54.6% | +6.8 |
The top of that table is heroes that win by existing. Bristleback turns his back and accumulates. Wraith King dies and then doesn't. Necrophos simply outlasts you. Sniper stands very far away. Not one of them requires the other four people on your team to have noticed anything.
The bottom is heroes that require somebody to be paying attention. Enigma's Black Hole is worth precisely as much as your team's willingness to follow it up. Chen, Visage and Lycan all ask you to control units that aren't your hero. Oracle is a support whose entire kit can, with enthusiasm, be used to kill your own carry. Earth Spirit and Puck are mechanics exams.
That's the finding, and I think it's lovely: the low-rank hero pool is a list of heroes that punish inattention, and the high-rank hero pool is a list of heroes that reward coordination. Not good heroes and bad heroes. Heroes whose value is contingent on the room.
Chen turns up in that right column at +5.5 points, incidentally. Part 4 ended with me noting that the model had decided Chen was weird without ever being told what a Chen is. The model and the ladder appear to agree.
The Bit That Doesn't Fit
I would love to tell you this cleanly explains the Part 2 result -- that heroes simply matter less as you climb, leaving the model less to work with. I checked, because that's the obvious next claim, and I've been burned this month by not checking obvious next claims.
The spread of hero win rates within each bracket: 2.79 points of standard deviation in Herald, then 2.76, 2.61, 2.52, 2.47, 2.43 by Ancient -- and then back up to 2.46 in Divine.
It narrows, but only by about twelve percent, and it stops narrowing at the top. That won't carry "heroes matter less up there," and the uptick at Divine actively argues against it. The honest version is smaller and more interesting: the amount of signal in hero identity is roughly constant all the way up the ladder, but which heroes carry that signal changes completely.
The signal doesn't shrink. It moves.
Which is an awkward thing to learn about a model I've been training on all ranks at once, because it means my win-probability model has been quietly averaging two populations that disagree about Bristleback by eight points. Rank isn't a filter I apply to tidy up the data. It's a variable the model needs to condition on. That's Part 6's problem and I'm looking forward to it.
One more, since I had the file open. Radiant wins about 53% of Dota games -- this is famous, it's the map, everyone knows. I assumed stronger players would exploit that asymmetry harder. Herald through Divine: 52.99%, 53.09%, 53.05%, 53.13%, 53.10%, 53.15%, 53.23%. Essentially flat. Whatever edge Radiant has, two thousand hours of practice does not help you use it.
Takeaway
The engineering lesson is the one I keep circling. I optimized inside an approach for a month without once measuring the ceiling of that approach. Every piece of that paging collector was sound work in the service of a plan whose best possible outcome was ninety days of waiting. A resumable cursor over the wrong endpoint is still a resumable cursor. It is just also the wrong endpoint.
But the thing I actually want to say is smaller and much more cheerful than that.
I spent two years treating data as the expensive part and analysis as the thing I'd get around to eventually. Then the data got cheap, and it turns out I have so many questions. Do heroes rise and fall together over a patch? Does the meta differ by region -- the archive knows which server every game was played on, and I already know the world plays on different clocks. Does the Radiant advantage move with game length? What do the drafts themselves look like, once I've collected enough of them?
I don't have a recommender yet. I have 26.7 million matches in a frozen snapshot with a fingerprint and a leakage check, 196 validated draft sequences and counting, and a list of questions that keeps getting longer instead of shorter.
That is a much better problem than the one I had last month.
The most-picked hero in Dota, by the way, is Pudge. Seven million appearances -- he is in more than one game in four, at every rank, from Herald to Divine.
His win rate across those seven brackets: 51.6, 51.7, 51.6, 51.4, 51.1, 51.0, 50.9.
Twenty-six million matches, and the most popular hero in the game is exactly as mediocre no matter who picks him. There is a lesson in there somewhere and I intend to keep not learning it.